How USPS used review data to improve customer service and reduce costs
When we talk about social data, we don’t just mean information coming from the main social media platforms. Yes, social media is a useful source of information for learning more about how your customers perceive your brand, but there are other social data sources that can provide even more valuable information. That’s what Mary Beth Levin, Manager of Social Strategy and Analytics at the US Postal Service (USPS) discovered after taking SILab’s Social Intelligence Growth Certification.
Gathering social data to map customer complaints
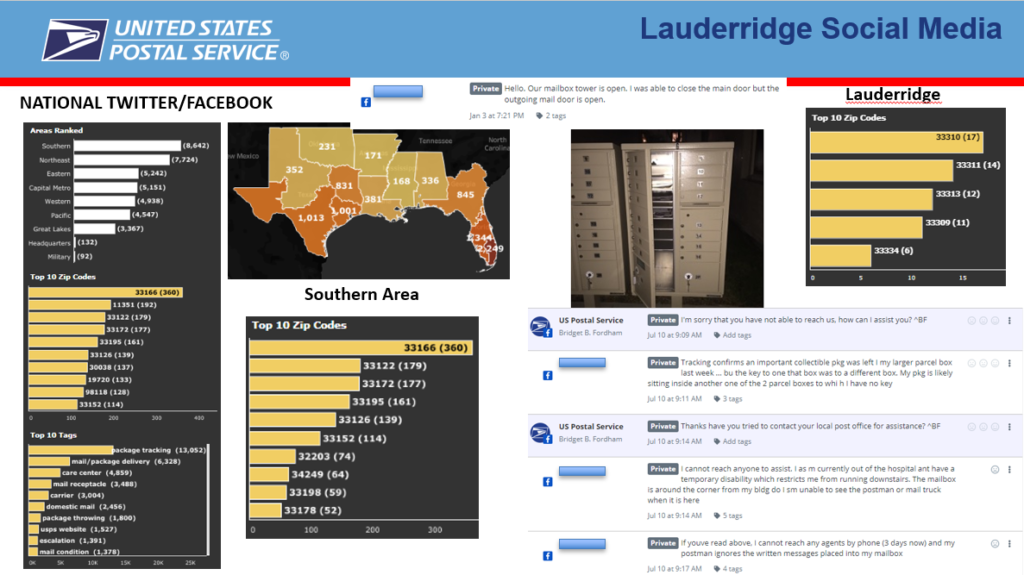
Mary Beth and her team were investigating customer complaints in order to develop a strategy to improve customer service at USPS. Initially, the team focused on tracking customer concerns that were coming to them via their corporate Twitter and Facebook channels.
Through this, they were able to associate the comments to the relevant zip code, and create an interactive heat map showing the range and volume of customer complaints.

Whilst this provided a useful indication of where there were customer service issues, it wasn’t showing the whole picture. Following the SILAB Social Intelligence Growth Certification, Mary Beth and her team decided to incorporate review data from 24 customer review sites.
The course taught her that social data is more than social media data. It includes all kinds of unstructured data that can be found on the internet, from reviews sites to forums to comments sections on news sites. By analsying all conversations that are happening online, you can learn a lot about your target audience.
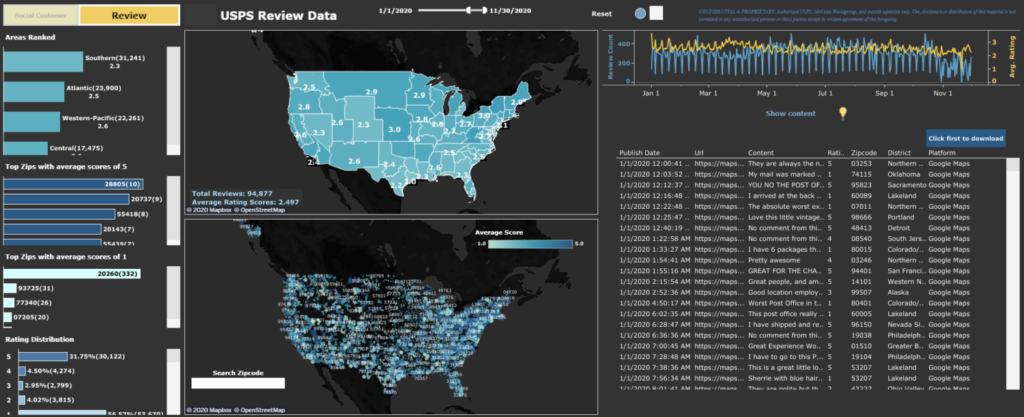
By adding customer review data to the social media information, Mary Beth and her team were able to build a much clearer picture of USPS customer experience across the country.

Including results of 24 online review sites created a "one-stop-shopping" experience for those wanting a comprehensive view of local social media conversations.[/caption]
How did USPS gather this data?
To gather the vast swathes of relevant unstructured data for this project, Mary Beth’s team used Khoros, their social customer response tool, and Yext to pull online reviews. To visualise the data, they used Tableau.
Listening tools are limited when it comes to geolocation or location-related insights. Much of the data analysis was done manually as they needed to be able to link comments to specific zip codes. This information isn’t shared by social media platforms, and you can’t rely on the information people include in their bios as it’s not always accurate. Many people move without updating their details. As the USPS asks for zip codes and tracking numbers in their interactions with customers, they can map-out the comments associated with them.
What happens to these insights?
These insights were fed back directly to the postal carrier, in short, in-person conversations or weekly emails. This alerted them to complaints in their own regions. Mary Beth’s team found that although both approaches were effective, conversations worked better than emails in engaging the teams with the issues.
The dashboard they put together included a heatmap, as well as top concerns, images and video taken directly from customers/ social media. This visual element really helped to get the message across: people know that they don’t want the area they work in to show as red!
The inclusion of qualitative data really helped too. For example, when specific people are named in reviews for positive actions, it has a motivating effect when shared.

Dashboards include a heatmap, top concerns, images and video taken directly from customers/ social media
The team also makes sure to share positive feedback, as well as negative, to motivate them to do better, and show that social media isn’t the enemy.
Having implemented this system, the team now finds this form of data sharing more effective than other forms of feedback. For example, Point Of Sale survey data often only shows the extremes in positive and negative sentiment. The surveys can be quite long and complicated for people to complete, resulting in data gaps. And the representation of the data is not always very user-friendly. The combination of qualitative and quantitative data resonated with employees who may not find graphs and charts compelling. They also recognize that much of the data being shared is oftentimes publicly posted.
What were the results?
After moving to this new way of sharing customer feedback, Mary Beth’s team saw a 54% decrease in customer concerns in regions using the heatmap. And when they reached out by email, they saw a 35% decrease.
Not only did this process reduce the number of concerns they received via social media, but also the number of phone complaints they received. Areas implementing the heatmap also saw an 18% decrease in Electronic Care Cases. Since USPS spends $72 per phone call and $38M annually on ECCs, the program is being implemented nationwide since the potential savings are immense.

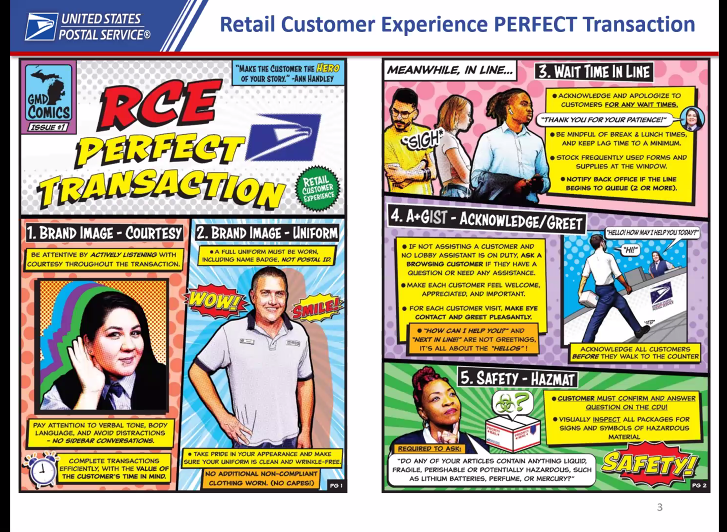
The heatmap has been used to measure the effectiveness of interactions such as this manga promoting customer service approaches.
The heatmap has been used to measure the effectiveness of interactions such as this manga promoting customer service approaches.
Off the back of this work, Mary Beth’s team have also uncovered new insights that can help the wider business. For example, they now have evidence that links low-scoring customer service regions with lower employee engagement, and vice versa. This highlights the importance of employee engagement in customer service, and shows how it feeds directly into cost savings for the organisation.
The team is also discovering new use cases for this process. For example, USPS wanted to test new tracking software, and decided to use customer feedback to assess its usefulness. They released the new software in limited zip codes and monitored customer complaints relating to tracking. There weren’t more complaints than previously, suggesting the new system was not causing any issues. They’re now rolling it out to 17K more zip codes.
As we can see from this case study, simply expanding the variety of data sources you’re using can help you to build a bigger picture of the problem you’re trying to solve. More data doesn’t always mean more insight, but in this case, by expanding to the highly relevant source of customer review sites, Mary Beth’s team was able to understand the problem better and build a solution to solve it.
The way you share the insights is also important. The visual element of the heatmaps helped the users understand the message better. And, delivering this feedback in person rather than by email proved more effective in triggering action.
By finding out the best method for processing and sharing the data, USPS were not only able to improve customer experience, but also reduce costs. A win all round!
Key takeaways
When developing your own social listening projects, think about the following:
- Which data sources will give you the most reliable information for the question you’re looking to answer?
- What are the different ways you can process and analyse the data? Sometimes manual analysis is more effective than using tools
- What’s the best way to approach manual data analysis to find meaningful insights?
- How can you share the information in a way users will understand AND be motivated to take action?
- Solving one problem can also offer solutions to others. How can the work you’ve done be adapted to other business challenges?
This interview was recorded via LinkedIn Live, if you prefer to view on LinkedIn, click the button below.
View InterviewSee related content


